CMJ vs Squat Jump: The Simplest Jump Bottleneck Test
The difference between your countermovement jump and squat jump reveals whether strength or elastic use is your limiting factor.
Two jumps, one number that tells you where to train. The comparison between the squat jump (SJ) and countermovement jump (CMJ) is the simplest bottleneck diagnostic in jump training — and you can run it with a tape measure.
The test is powerful because it isolates one variable: what the countermovement adds is the stretch-shortening cycle, and the size of that contribution tells you whether strength or elasticity is the bottleneck.
What each jump measures
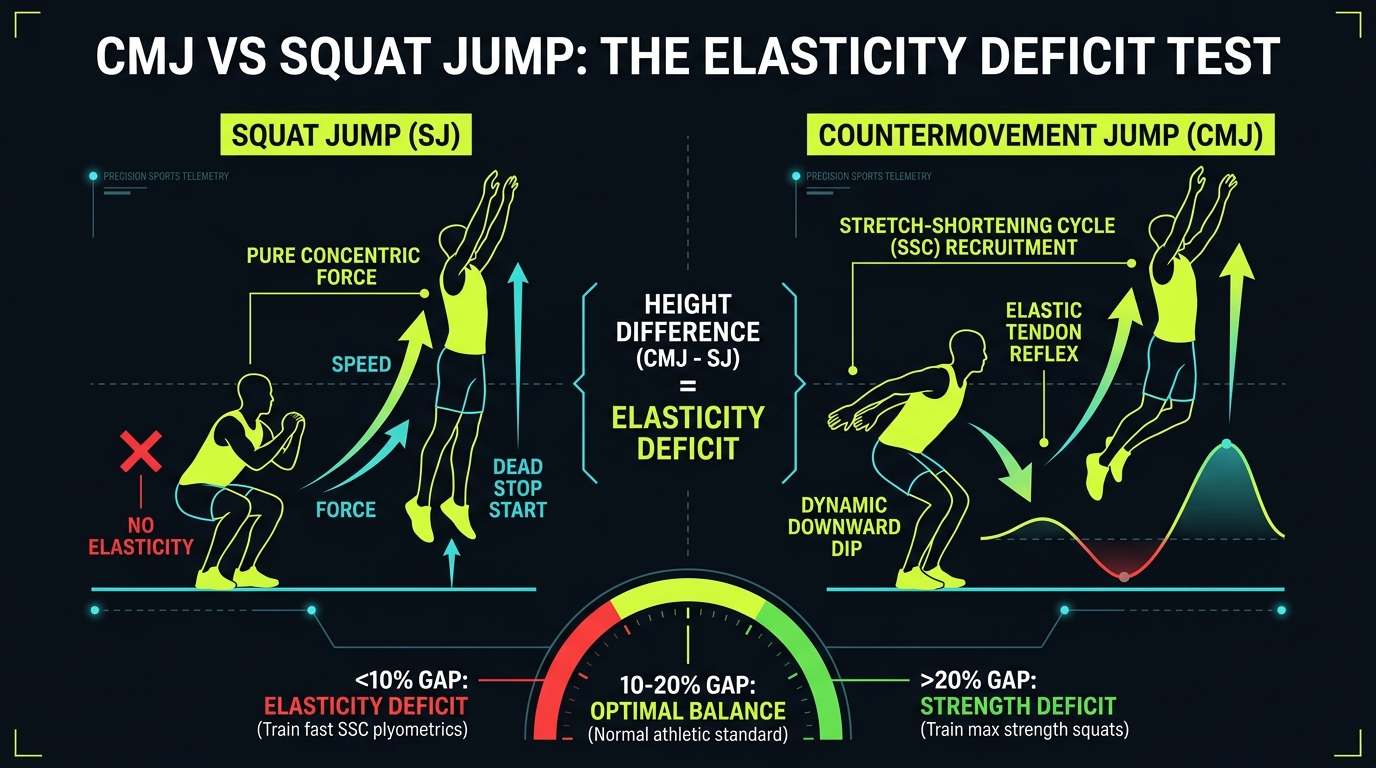
The squat jump starts from a static half-squat and measures pure concentric ability — how much force your legs can produce from a dead stop. The countermovement jump adds a dip, which recruits the stretch-shortening cycle, measuring concentric ability plus elastic contribution.
The 10–20% rule and EUR
For most athletes the CMJ is 10–20% higher than the SJ. In peer-reviewed sports science (e.g., McGuigan et al., 2006), this relationship is formally measured as the Eccentric Utilization Ratio (EUR): EUR = CMJ ÷ SJ. A balanced, optimal EUR sits between 1.10 and 1.15.
That gap represents your stretch-shortening cycle (SSC) elastic contribution. The metric only becomes actionable when compared against that baseline: values under 1.05 point to an elasticity deficit, while values above 1.20 indicate an untapped maximum strength deficit.
What your difference means
Interpretation is directionally simple:
- Large difference (EUR > 1.20 or over 20% gap): strong elasticity but relatively weak concentric strength → prioritize max strength work (heavy squats, trap-bar deadlifts).
- Small difference (EUR < 1.05 or under 10% gap): strength reserve exists but is not being converted into velocity → prioritize reactive plyometrics and SSC exercises.
Test it cleanly
Use the same jump mat or video protocol for both tests, rest 2–3 minutes between attempts, and take the best of three. A standardized assessment that includes both jumps tells you which direction to push without guessing.
The mechanism behind the gap
The review by Van Hooren and Zolotarjova confirms that CMJ performance is almost always better than SJ, and the gap is interpreted as effective use of the stretch-shortening cycle — preactivation, elastic energy storage and the stretch reflex.
That interpretation is useful, but not automatic: the gap also depends on technique, dip speed and testing conditions, which is why the protocol must be identical for both jumps.
What a very large gap really means
A gap above 20% of CMJ usually indicates strong elasticity with relatively weak concentric strength — the athlete can use stored energy but cannot produce enough force from a dead stop. The training answer is max strength work.
The opposite — a gap under 10% — means strength exists but is not being converted into jump height; that points to plyometric and SSC work.
A practical testing protocol
Run both jumps in one session with identical conditions:
- Same warm-up, shoes and surface.
- SJ from a static half-squat, hands on hips or arms crossed.
- CMJ with a free arm swing (or the same arm constraint for a purer comparison).
- 2–3 minutes rest between attempts, best of three each.
- Compute both the direct ratio (EUR = CMJ ÷ SJ) and the percentage gap ((CMJ − SJ) ÷ CMJ × 100%) to track monthly.
Key takeaways
- SJ measures pure concentric strength; CMJ adds the stretch-shortening cycle (SSC) contribution.
- A normal CMJ−SJ gap is 10–20% (EUR = 1.10–1.15).
- EUR > 1.20 (big gap) → train strength. EUR < 1.05 (small gap) → train plyometrics.
- The gap reflects SSC utilization — an oversized gap usually means a strength deficit.
- Test both jumps in the same session under identical conditions.
Related calculators
References
- Van Hooren & Zolotarjova (2017) Sports Med
- Bobbert et al. (1996) Med Sci Sports Exerc
- McGuigan et al. (2006) J Strength Cond Res - Eccentric Utilization Ratio
- PubMed: The difference between CMJ and SJ — mechanisms review (2017)
- EJSS: SJ vs CMJ across 770 athletes (2021)
Keep reading
TESTING & ASSESSMENT
The Force-Velocity Profile: What It Is and Whether You Need It
The F-V profile tells you whether strength or speed is your bottleneck — and when you are not ready for it yet.
TESTING & ASSESSMENT
How to Track Jump Progress Scientifically
One standard test, fixed conditions, weekly frequency and the smallest worthwhile change — the protocol that turns jump data into decisions.
TESTING & ASSESSMENT
Which Training Gives the Most Jump Per Hour?
The ROI ranking: foundational strength first, then power conversion, depth jumps, technique — and supplements last.